💥 Imagine the Sun unleashing a monstrous explosion in real-time, caught simultaneously by two advanced space telescopes tracking destructive space weather.
Massive X-class solar flares constantly threaten our high-tech world by blasting billions of tons of magnetized plasma toward Earth. These sudden cosmic eruptions can instantly disable global communication networks, shatter electrical power grids, and disrupt modern orbital navigation tracking systems without warning.
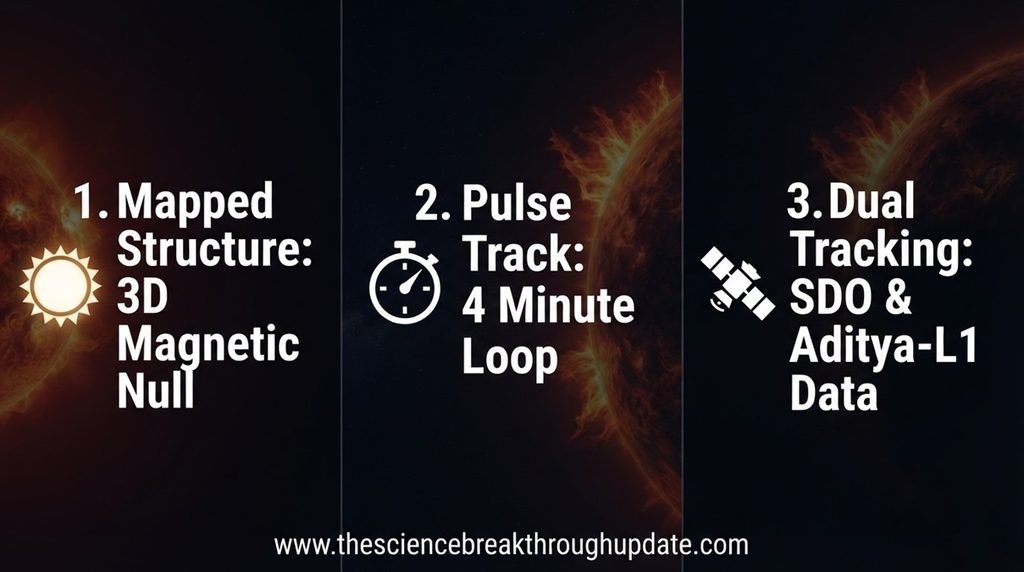
To solve this mystery, researcher P. Pawan Kumar from Patna University analyzed an intense eruption using shared space telescope data. By combining tracking sensors from NASA’s Solar Dynamics Observatory and ISRO’s Aditya-L1 satellite, the team successfully mapped the structural physics driving these blasts.
⚡ The Hidden Danger Lurking Inside Solar Magnetic Fields
- Severe magnetic energy discharges create severe solar storms, but directly tracking their invisible origin structures remains incredibly difficult due to low plasma densities.
- Predicting these chaotic eruptions requires deep mapping because the underlying twisted magnetic field lines hide from standard planetary telescope viewing arrays.
- Massive electrical currents secretly gather along complex quasi-separatrix layers, creating intense structural strain that warps the surrounding solar atmosphere prior to detonation.
- Unpredictable radiation bursts emit quasi-periodic pulsations during the impulsive phase, creating erratic high-energy fluxes that easily blind standard single-satellite observation networks.
🛰️ How Dual Spacecraft Exposed the Cosmic Eruption Site
- Astronomers tracked active region NOAA 13848 using an advanced non-force-free-field extrapolation model to reconstruct the pre-flare coronal magnetic field configuration.
- The high-tech AIA instrument onboard SDO captured clear sigmoidal brightenings across extreme-ultraviolet channels right as the massive solar event initialized.
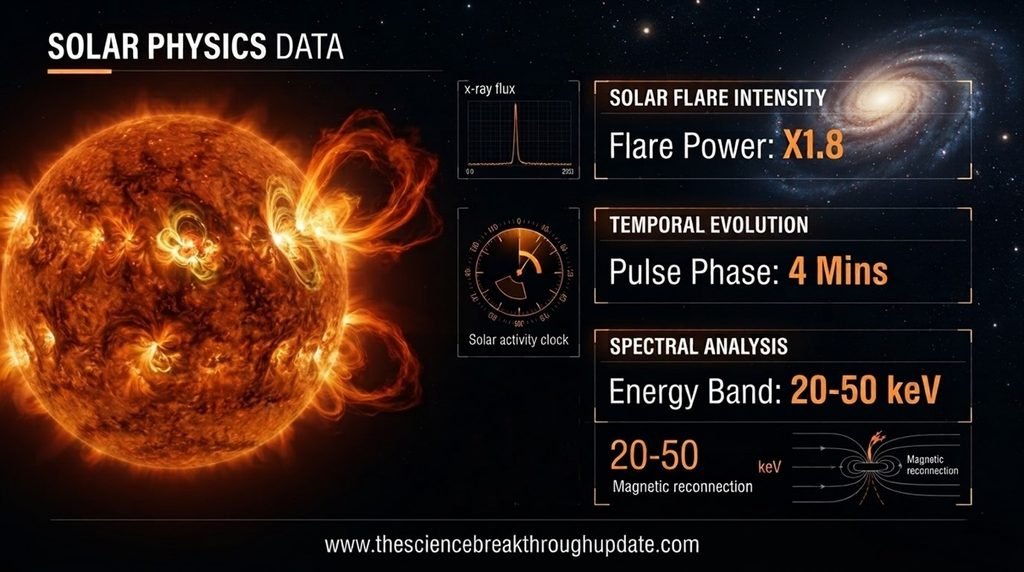
- The specialized HEL1OS spectrometer onboard Aditya-L1 isolated distinct radiation pulsations maintaining a dominant 4-minute period within 20-50 keV hard X-rays.
- Joint tracking coordinates from the STIX instrument onboard Solar Orbiter successfully aligned the hard X-ray source contours with ultraviolet flare ribbons.
🛡️ Securing Our Global Technology From Galactic Disasters
- Confirming that the core twist parameter exceeds a value of 1 validates the structural presence of a low-lying magnetic flux rope.
- Probing the three-dimensional magnetic null proves that repeated reconnection episodes remove strapping fields to unlock dangerous, suspended cool filament material.
- Measuring how the local decay index reaches a critical value of 1.5 helps scientists identify the exact cosmic torus instability threshold.
- Combining synchronized data across extreme-ultraviolet and hard X-ray channels provides an exceptional framework for forecasting episodic particle acceleration events worldwide.
My Take: Tracking these solar pulses directly shields our modern power grids from sudden outer space blackouts. It transitions our space weather defense from erratic guesswork into highly accurate, real-world forecasting.
❓ Reader Doubts: Core Questions Answered
- What unique features did the non-force-free-field model reveal within the flaring region?
The non-force-free-field extrapolation model revealed a complex pre-flare magnetic configuration containing a magnetic flux rope, a three-dimensional null point, a sheared arcade, and multiple quasi-separatrix layers. These unique features worked together to drive the initial solar reconnection. - How long did the observed quasi-periodic pulsations last and what was their exact period?
The pulsations were explicitly detected during the impulsive phase of the flare, lasting from approximately 01:35 UT to 01:50 UT. Spectral analysis confirmed that these high-energy radiation pulses maintained a dominant period of about 4 minutes. - Which spacecraft contributed to this multi-wavelength discovery and how was the source confirmed?
Data from NASA’s SDO and ISRO’s Aditya-L1 captured the core event, while Solar Orbiter provided critical hard X-ray tracking. The STIX instrument confirmed the exact source by aligning X-ray contours directly with the primary ultraviolet flare ribbons.
Source Document Link: arXiv.org
Share this useful knowledge with your friends now!”
Disclaimer: This content is based on preliminary scientific research (Preprints) from arXiv.org and current global findings. It is shared strictly for educational and informational purposes and does not constitute professional, legal. Readers are encouraged to verify facts independently and consult relevant experts before making any decisions.