
🚨 Scientists have finally decoded the mathematical mystery explaining why deadly viruses return in relentless, unpredictable cycles.
Many public health experts traditionally assume that simple epidemic tracking models fail because real-world disease transmissions are far too complex to capture cleanly. However, hidden mathematical equations now prove that basic frameworks can accurately replicate multiple viral waves without adding unnecessary structural layers to the equations.
A definitive study reveals how adjusting a single variable allows classic frameworks to mirror complex infection spikes completely across different timelines. By focusing closely on dynamic parsimony, researchers are quietly rewriting the rules of how global agencies monitor and prepare for major ongoing public health crises.
🦠 Why Standard Tracking Tools Misjudge Infection Waves
- Traditional surveillance tools often demand heavy modifications because a single static parameter cannot account for erratic behavioral shifts across large human populations dynamically.
- Adding extra variables to equations introduces severe mechanistic identifiability issues where multiple entirely distinct real-world causes yield identical case trends during analysis.
- Standard pointwise least squares methods frequently mask critical inter-peak trough data by over-prioritizing the largest initial surge during a major ongoing disease outbreak.
- Epidemiologists regularly struggle to isolate true biological traits because raw case counts fail to separate transmission speed from patient removal rates cleanly and accurately.
📐 Stripping Down the Math to Predict Resurgences
- Lead researcher Jomar Fajardo Rabajante from the University of the Philippines Los Baños created an innovative framework called minimal peak-preserving complexity to solve this.
- This elegant method utilizes a flexible time-varying effective transmission rate to absorb the complete net impact of omitted biological and environmental factors seamlessly.
- The algorithm applies peak-aware approximate Bayesian computation to capture wave topology, timing, and height without adding complex demographic compartments or stratification layers.
- By regularizing the log-transmission curve with discrete knots, the system achieves flawless trajectory compression using the simplest mathematical equations available today.
🔮 Reimagining Public Health Surveillance and Future Planning
- Rigorous testing across 6 distinct stress tests proved the model successfully tracks multiple wave topologies even when entirely ignoring complex age-mixing social structures.
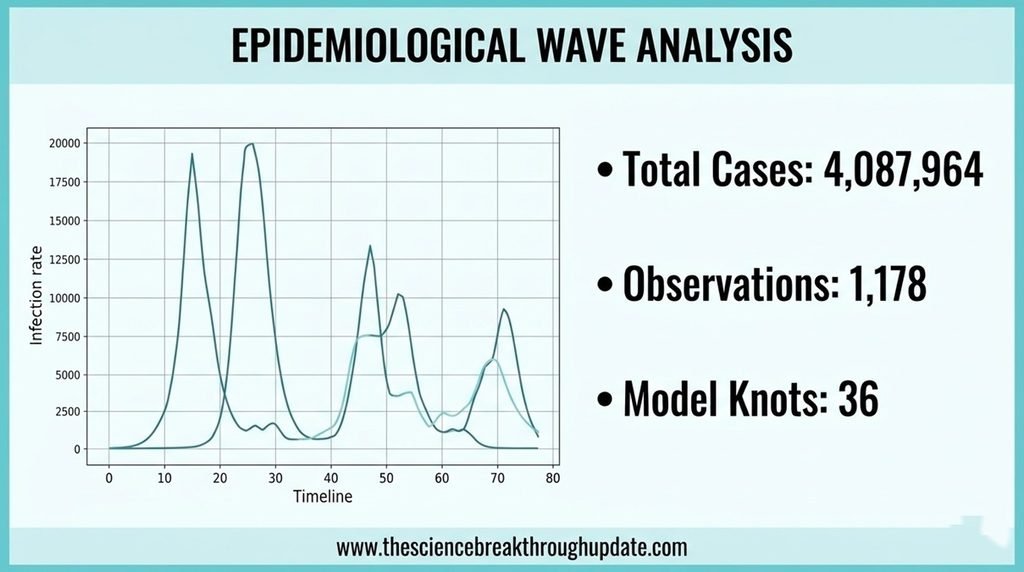
- The system compressed exactly 4,087,964 reported cases across 1,178 observations from real national tracking data into an auditable 36-knot reference trajectory with high accuracy.
- Public health agencies can deploy these compressed reference models to run cautious short-horizon projections based on incoming real-time variant tracking data.
- This breakthrough provides an objective benchmark that separates descriptive curve-fitting limits from true underlying biological causation in global disease tracking workflows.
My Take: Ditching bulky data for simpler, flexible math cuts through outbreak noise perfectly. It keeps public health tracking realistic, ensuring agencies accurately spot oncoming resurgences before panic strikes.

❓ Reader Doubts: Core Questions Answered
- Can a simple model really predict multiple virus waves?
Yes, it absolutely can. By allowing the transmission rate to vary fluidly over time, a basic framework successfully reproduces repeated infection spikes without introducing cumbersome new variables. This flexible method completely bypasses the traditional requirement for high-dimensional state structures. - Why do infection waves occur in cycles?
Waves typically occur due to constantly changing human behaviors, seasonal environmental adjustments, and rapidly emerging viral variants. These dynamic real-world factors continuously alter how easily a virus spreads through a susceptible population. This creates highly fluctuating infection patterns over extended tracking periods. - How does this research help public health officials?
It provides an exceptionally cleaner way to compress past pandemic outbreak data efficiently for medical surveillance teams. Officials can easily use these simplified mathematical baselines to construct smarter, highly realistic short-horizon forecasting scenarios. This helps maximize critical resource allocation during evolving emergencies.
Source Document Link: arXiv.org
Share this useful knowledge with your friends now!”
Disclaimer: The information on this website is for educational and informational purposes only and is not intended as medical advice. Always consult a qualified healthcare professional before making any medical decisions or changes to your treatment plan.